
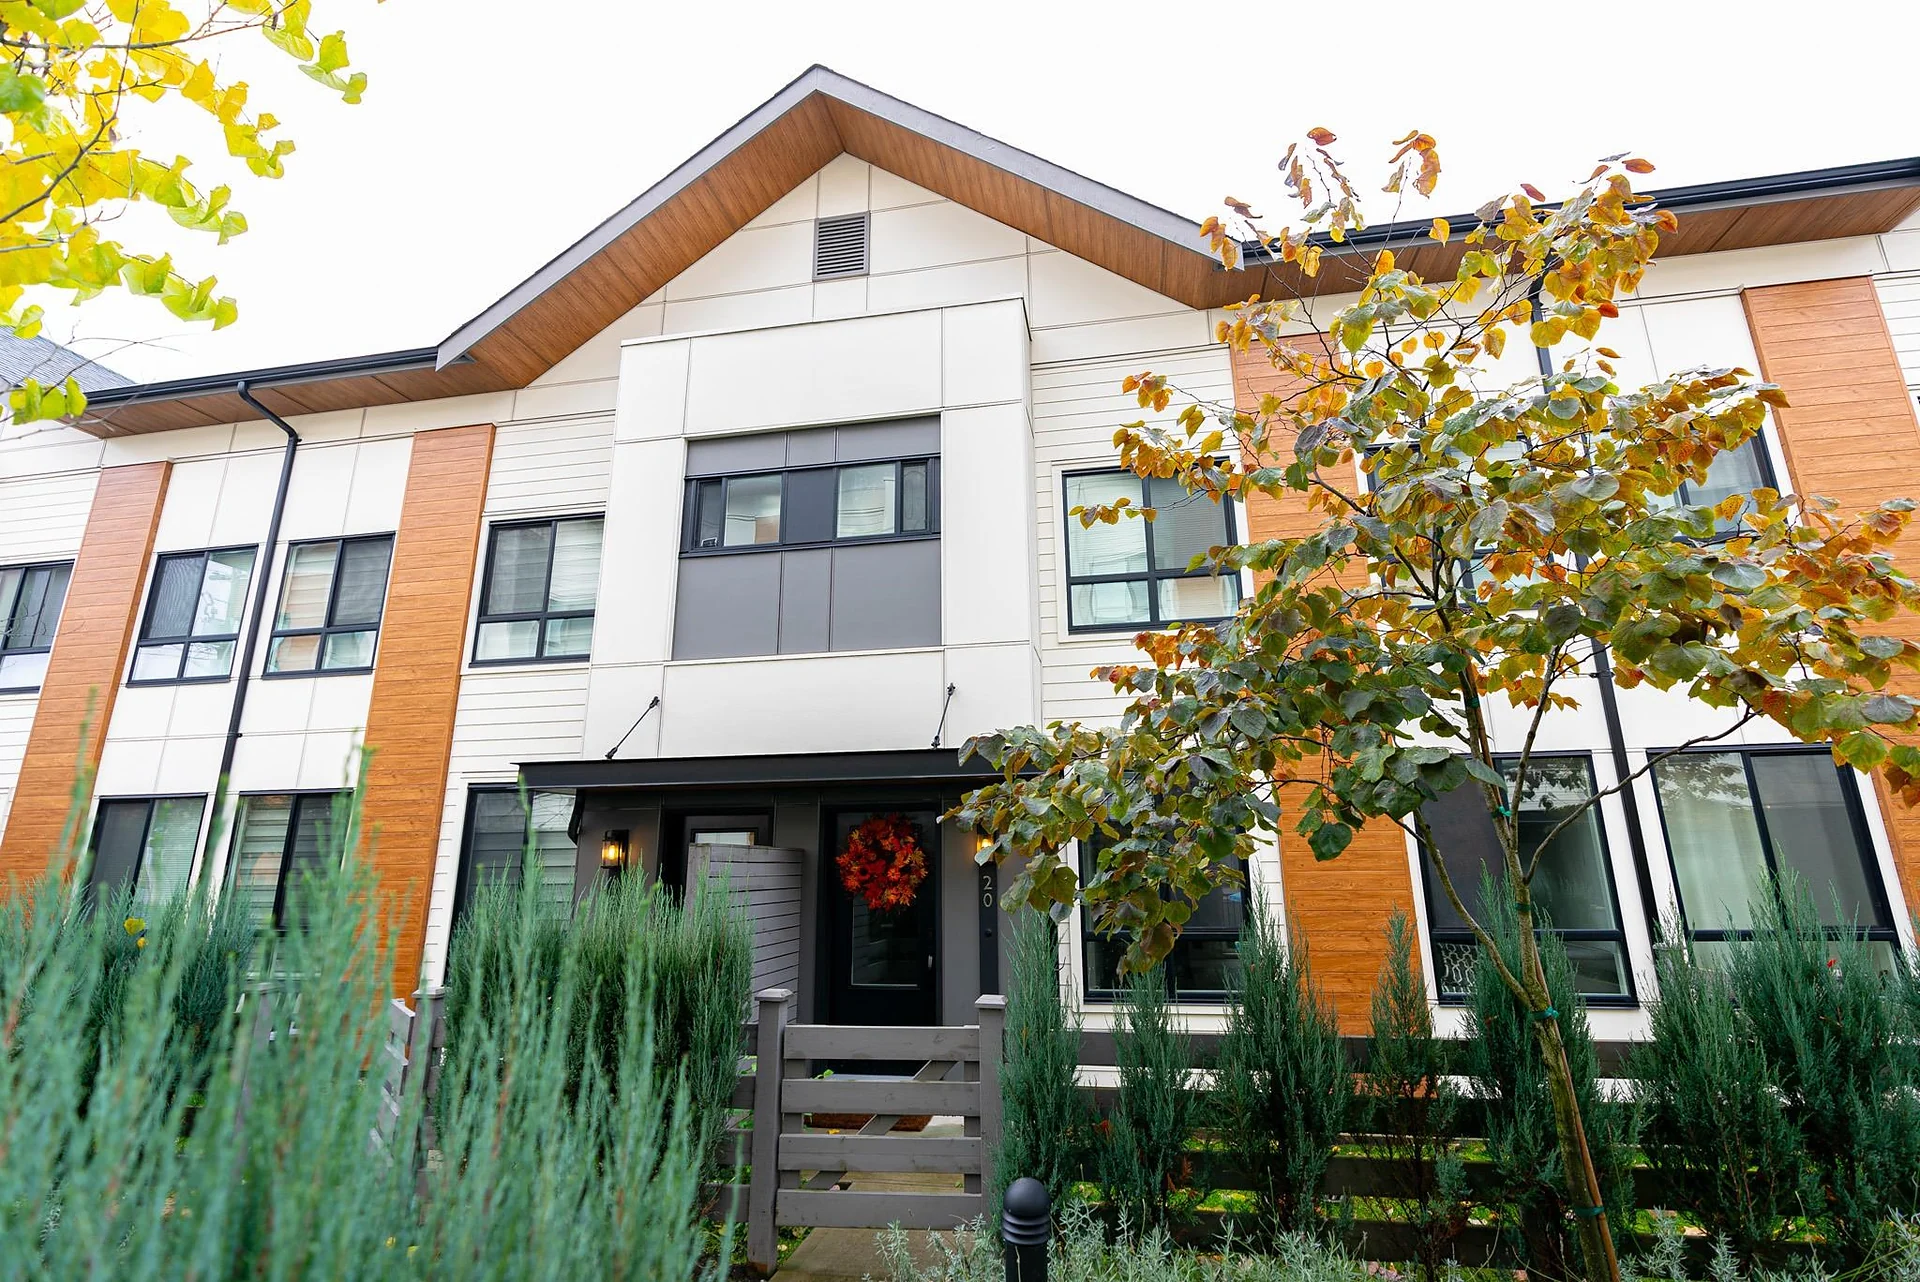
Here is where the Langley real estate market stood in September 2026, based on the Fraser Valley Real Estate Board's latest monthly figures. Langley recorded 226 home sales against 1,438 active listings, a sales-to-active ratio of about 15.7%, which puts it in balanced territory while most of the Fraser Valley sits in a buyer's market. Benchmark prices were still lower than a year earlier: down 6.6% for detached homes, 4.4% for townhouses and 9.2% for apartments.
We refresh this page each month when the board releases new numbers. If you would like to know how these trends apply to your home or the area you are shopping in, a Langley realtor on our team can pull recent sales for your street.
Langley benchmark prices by home type
The benchmark price is the board's estimate of a typical home of each type. It smooths out the swings you see in average or median sale prices. These are the September 2026 benchmarks for Langley:
| Home type | Benchmark price | Change from August 2026 | Change from September 2025 |
|---|---|---|---|
| Detached | $1,471,100 | down 0.5% | down 6.6% |
| Townhouse | $802,600 | down 0.4% | down 4.4% |
| Apartment | $525,900 | down 1.5% | down 9.2% |
Langley's declines over the year are smaller than the Fraser Valley averages for detached homes and townhouses. Monthly changes were small, so prices are drifting lower rather than falling quickly. A benchmark tells you the direction of the market, not the value of one particular home. For more on the area, see our Langley real estate page.
City of Langley and Township of Langley
Many people ask for separate numbers for the City of Langley and the Township of Langley. The board publishes one set of Langley figures that covers both the City and the Township, so the prices and counts on this page apply to the whole Langley area. Within that area, values can differ a lot between neighbourhoods such as Willoughby, Walnut Grove, Brookswood and the City centre, which is why we always look at recent sales on the specific streets you care about.
Sales, listings and the sales-to-active ratio
The Langley housing market was one of the steadier parts of the Fraser Valley in September 2026:
- Sales: 226, up 3.1% from August and up 4.1% from September 2025.
- New listings: 583, up 20.7% from August and down 20.5% from a year earlier.
- Active listings: 1,438, up 0.8% from August and down 17.8% from a year earlier.
- Sales-to-active ratio: about 15.7% (226 sales divided by 1,438 active listings).
The board describes a balanced market as a sales-to-active ratio between 12% and 20%, and it labelled Langley a balanced market for September. It also listed Langley as the tightest market in the Fraser Valley, with about 6.2 months of inventory, meaning it would take a little over six months to sell every listed home at the current pace.
Activity by home type
The board's September 2026 counts for Langley by home type:
| Home type | Sales | New listings | Active listings | Sales-to-active ratio |
|---|---|---|---|---|
| Detached | 64 | 189 | 449 | about 14.3% |
| Townhouse | 61 | 150 | 283 | about 21.6% |
| Apartment | 67 | 159 | 416 | about 16.1% |
Townhouses stood out. With 61 sales against 283 active listings, the townhouse segment was just above the top of the balanced range, and its benchmark fell the least over the year. If a townhouse is on your list, browse current Langley townhomes for sale to see what is available.
How long homes are taking to sell
The board publishes average days to sell for the whole Fraser Valley rather than for each community. In September 2026, a detached home took 45 days on average, a townhouse 38 days and an apartment 46 days. Given Langley's stronger ratio, well priced homes there may sell faster than these region-wide averages.
What it means if you are selling
Langley sellers are in a better spot than sellers in much of the Fraser Valley. Active listings are 17.8% lower than a year ago and sales are up, so there is less competition for each buyer. Still, prices are lower than in 2025, and buyers compare carefully.
- Price from recent sales in your neighbourhood, not from last year's numbers or nearby asking prices.
- Prepare the home before listing. The first two weeks bring the most attention.
- Know your segment. Townhouses were the most active type; detached homes had more choice for buyers.
A free home valuation is a good first step to see where your home fits in the current Langley market.
What it means if you are buying
Buyers in Langley have less leverage than buyers elsewhere in the Fraser Valley, but prices are still below last year. Apartments have seen the biggest drop, down 9.2% over the year, which may help first-time buyers. Get pre-approved, watch sold prices for homes like the one you want, and be ready to move on a good townhouse, since that segment is the most competitive.
The Fraser Valley picture and interest rates
Across the whole Fraser Valley in September 2026, the board recorded 922 sales, down 2% from August and 4% from a year earlier, with 2,818 new listings and 9,763 active listings. The region-wide sales-to-active ratio was about 9%, a buyer's market. The Fraser Valley benchmark was $1,300,000 for a detached home, $745,300 for a townhouse and $461,800 for an apartment, down 8.8%, 6.2% and 9.3% from a year earlier.
The Bank of Canada held its policy rate at 2.25% at its September 2, 2026 decision, where it has stayed since October 2025. Its next scheduled announcement is October 28, 2026, and we will reflect any change in next month's update.
Planning a move in Langley? Call us at 604-385-3770 or book a free 15-minute call with a Langley realtor on The Oberoi Group team. We will look at the latest numbers for your neighbourhood and help you plan your next step.
Frequently asked questions
Is Langley a buyer's or seller's market right now?
In September 2026 Langley had 226 sales and 1,438 active listings, a sales-to-active ratio of about 15.7%. The Fraser Valley Real Estate Board called it a balanced market.
What is the benchmark price of a townhouse in Langley?
The Fraser Valley Real Estate Board put the Langley townhouse benchmark at $802,600 in September 2026, down 4.4% from a year earlier.
Does the board publish separate stats for the City and Township of Langley?
No. The Fraser Valley Real Estate Board publishes one set of Langley figures covering both the City of Langley and the Township of Langley.
Is Langley more expensive than the Fraser Valley average?
Yes. In September 2026 the Langley detached benchmark was $1,471,100, compared with $1,300,000 for the Fraser Valley as a whole.
How often is this Langley market update refreshed?
We update it each month after the Fraser Valley Real Estate Board releases new figures, usually in the first week of the following month.
Sources
Rates, thresholds and program rules in this article were checked against these official pages on October 22, 2026. Rules change, so confirm current details before you act.