
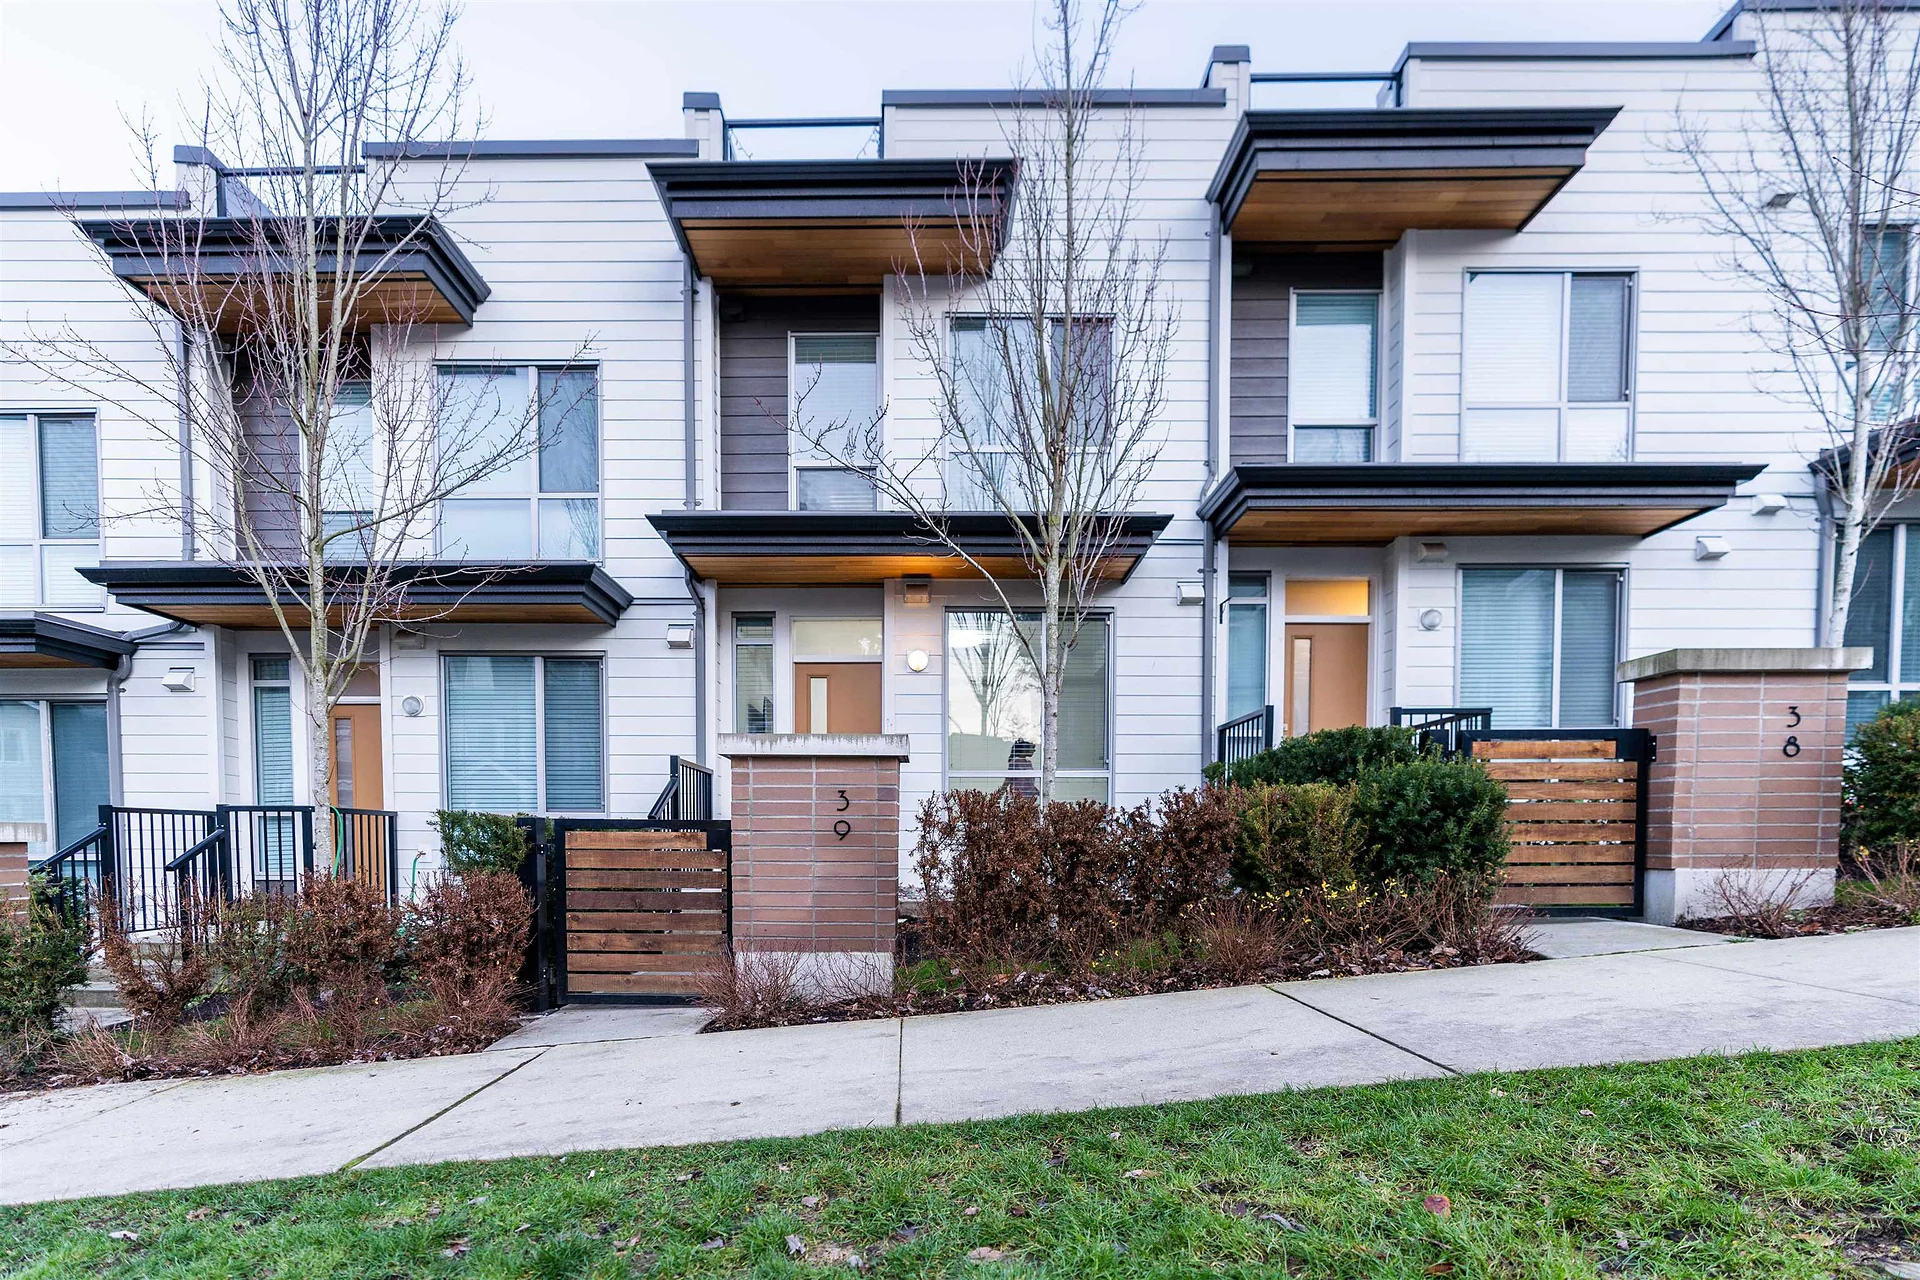
Here is where the Surrey real estate market stood in September 2026, based on the Fraser Valley Real Estate Board's latest monthly figures. Surrey recorded 404 home sales against 4,293 active listings, and benchmark prices were lower than a year earlier for every home type: down 8.2% for detached homes, 5.3% for townhouses and 9.9% for apartments. Buyers have more choice and more time, while sellers need sharp pricing to stand out.
We update this page each month when the board publishes new numbers. If you want to know what these figures mean for your street or your home, a Surrey realtor on our team can walk you through recent sales nearby.
Surrey benchmark prices by home type
The benchmark price is the board's estimate of a typical home of each type, so it moves more smoothly than average or median sale prices. These are the September 2026 benchmarks for Surrey:
| Home type | Benchmark price | Change from August 2026 | Change from September 2025 |
|---|---|---|---|
| Detached | $1,386,200 | down 1.5% | down 8.2% |
| Townhouse | $758,600 | down 0.8% | down 5.3% |
| Apartment | $447,600 | down 0.7% | down 9.9% |
Townhouses have held their value best over the past year, and apartments have seen the largest drop. Prices slipped again from August to September, so the trend has not turned yet. A benchmark is a guide to direction, not a price for any one home. For a broader look at the city, see our Surrey real estate page.
Sales, listings and the sales-to-active ratio
The Surrey housing market slowed from August to September, though sales were close to last year's level:
- Sales: 404, down 13.4% from August and up 0.7% from September 2025.
- New listings: 1,124, down 15.6% from August and 17.8% from a year earlier.
- Active listings: 4,293, down 2.6% from August and 9.4% from a year earlier.
- Sales-to-active ratio: about 9.4% (404 sales divided by 4,293 active listings).
The board describes a balanced market as a sales-to-active ratio between 12% and 20%. Below 12%, buyers usually have the upper hand and prices face downward pressure. At about 9.4%, Surrey sat in buyer's market territory in September 2026.
By home type, across the City of Surrey (North Surrey, Surrey Central, Cloverdale and South Surrey, not including White Rock), detached sales were the bright spot: 166 detached homes sold, up 7.1% from September 2025. Townhouse sales were 126, down 7.4%, and apartment sales were 95, down 22.8%.
How long homes are taking to sell
The board publishes average days to sell for the whole Fraser Valley rather than for each city. In September 2026, a detached home took 45 days on average, a townhouse 38 days and an apartment 46 days. Surrey makes up a large share of Fraser Valley sales, so these averages are a fair guide, but well priced homes in popular pockets can still move faster.
Prices by area: North Surrey to South Surrey
Surrey is a big city, and each part of it moves differently. The board's September 2026 benchmarks by area:
| Area | Detached | Townhouse | Apartment |
|---|---|---|---|
| Surrey Central | $1,304,100 (down 9.0%) | $749,600 (down 3.9%) | $460,200 (down 11.5%) |
| Cloverdale | $1,317,200 (down 6.9%) | $754,300 (down 5.6%) | $506,700 (down 8.9%) |
| North Surrey | $1,252,600 (down 10.9%) | $680,400 (down 8.0%) | $398,900 (down 10.5%) |
| South Surrey and White Rock | $1,612,500 (down 7.4%) | $797,100 (down 11.2%) | $544,400 (down 7.7%) |
Changes are compared with September 2025. North Surrey saw the steepest detached decline. In South Surrey and White Rock, detached sales rose to 60 from 41 a year earlier, a 46.3% increase, even as the benchmark fell. If you are watching the south end of the city, our South Surrey real estate page covers neighbourhoods and home styles there.
What it means if you are selling
With about 4,300 homes for sale and buyers taking their time, the homes that sell are the ones priced from recent sales and presented well from the first day. A few things work in your favour right now:
- Fewer new listings. New listings were 17.8% lower than a year ago, so there is less fresh competition than in 2025.
- Detached demand held up. Detached sales across the city were higher than a year earlier.
- Steady borrowing costs. Buyers have had a stable policy rate for close to a year.
The risk is overpricing. A home listed above the market tends to sit, collect price reductions and sell for less than it would have at the right number. Start with a free home valuation based on recent sales near you, and read our guide to selling your Surrey home for timing and preparation tips.
What it means if you are buying
Buyers have room to compare and negotiate. Detached benchmarks are well below a year ago, and the board noted that the Fraser Valley detached benchmark is now about $460,000 below its March 2022 peak. That said:
- Get pre-approved first so you can act when the right home appears.
- Look at sold prices, not asking prices, for homes like the one you want.
- Use conditions for financing and inspection. In a buyer's market, sellers expect them.
- Watch the well priced homes. Good homes in strong locations still draw several buyers.
Browse current Surrey homes for sale to see what is on the market today.
The Fraser Valley picture and interest rates
Across the whole Fraser Valley in September 2026, the board recorded 922 sales, down 2% from August and 4% from a year earlier. New listings rose to 2,818, up 19% from August as sellers returned after the summer. Active listings held at 9,763, still 31% above the 10-year average for the season, and the region-wide sales-to-active ratio was about 9%. The composite benchmark price for a typical Fraser Valley home fell 1% in the month and 7% over the year.
The Bank of Canada held its policy rate at 2.25% at its September 2, 2026 decision, the same level it has kept since October 2025. Its next scheduled announcement is October 28, 2026, and we will reflect any change in next month's update.
Thinking about buying or selling in Surrey this fall? Call us at 604-385-3770 or book a free 15-minute call with a Surrey realtor on The Oberoi Group team. We will look at the numbers for your area and help you decide on a plan that fits.
Frequently asked questions
Is Surrey a buyer's or seller's market right now?
In September 2026 Surrey had 404 sales and 4,293 active listings, a sales-to-active ratio of about 9.4%. The Fraser Valley Real Estate Board treats 12% to 20% as balanced, so Surrey was in buyer's market territory.
What is the benchmark price of a detached home in Surrey?
The Fraser Valley Real Estate Board put the Surrey detached benchmark at $1,386,200 in September 2026, down 8.2% from September 2025.
Which part of Surrey has the highest home prices?
South Surrey and White Rock had the highest detached benchmark in the board's September 2026 figures, at $1,612,500. North Surrey had the lowest, at $1,252,600.
How often is this Surrey market update refreshed?
We update it each month after the Fraser Valley Real Estate Board publishes new figures, usually in the first week of the following month.
Where is the Bank of Canada policy rate now?
The Bank of Canada held its policy rate at 2.25% on September 2, 2026. Its next scheduled decision is October 28, 2026.
Sources
Rates, thresholds and program rules in this article were checked against these official pages on October 22, 2026. Rules change, so confirm current details before you act.